How to Implement Debugging Quickly in Flutter?
11 Aug 23 


Debugging is a critical process in software development, including when working with the Flutter framework. In this article, we’ll walk you through simple yet powerful techniques for implementing quick and efficient debugging in your Flutter projects. We’ll also delve into the installation and utilization of the ‘logger’ package. Which effortlessly track API calls and gain deeper insights during the debugging process.
The process often entails analyzing code logic, examining data flow, and scrutinizing the interactions between different components. Effective debugging demands a keen problem-solving mindset, the ability to interpret error messages, and the utilization of assert statements for preemptively catching potential problems.
The inclusion of third-party packages like ‘logger’ enhances the debugging process by providing detailed logging capabilities, aiding in tracking API calls and improving overall code stability.
Techniques Used for Quick and Efficient Debugging in Flutter Projects
Quick Debugging Using Debugging Button
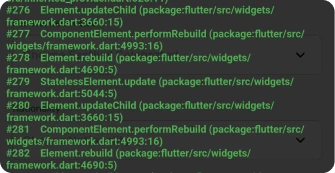
Mindster’s Flutter app development team has used a debugging button in the app itself. This allows to view the console within the smartphone. The Significant benefit of this debugging button is that the IDE (Integrated Development Environment) is not required at every time. So that a developer or a tester can access the logs at any time from anywhere in debug mode. Moreover If there is any API calls, it will get displayed on the screen.

This has helped our team to quickly and efficiently carry out debugging in flutter, without other techniques. Let’s explore those techniques that are apart from this method; that are some conventional methods followed by the developers.
Talking to Your Code: The Power of Print Statements
Debugging could sound complex. However, one of the easiest and best devices in your debugging arsenal is the humble print() statement. Consider it having a discussion with your code. Very much like leaving sticky notes for yourself, adding print() statements decisively all through your code allows you to see what’s going on at various places in your application’s execution.
It resembles a breadcrumb trail that guides you through the exciting bends in the road of your code, assisting you with grasping the flow and conduct. Imagine that you’re on an excursion through your application, and at each critical stop, you leave a note. These notes, shown in the console, tell you about the values of variables, the progress of loops, and the sequence of events.
It’s a moment preview of what’s happening underneath the surface. This permits you to confirm on the off chance that your presumptions about the code’s conduct match reality.
Pausing for Clarity: Using Breakpoints
Consider reading a page-turning book where you want to savour every exhilarating turn. So that you may pause and take in the details, you’d put bookmarks on important situations, right? Debugging breakpoints are similar to those bookmarks. They let you stop your code’s execution at particular times so you can closely study how it works.
Here’s how it works, you’re exploring through your code, and you spot a line where you suspect. Something may be wrong perhaps a variable isn’t holding the value you expect, or a conditional statement isn’t acting as it ought to. You place a breakpoint not too far off, such as dropping a pin on a guide. Rather than think about what’s turning out badly.
Then, when you run your Flutter app in debugging mode, it stops right at that breakpoint. Which allows you with an opportunity to look into the code’s state and conduct. Once stopped, you can investigate the values of variables, step through the code line by line, and even execute code snippets manually to see their effects. It resembles having an amplifying glass to investigate all your code’s moves.
This level of interaction and observation enables you to uncover the root causes of issues. Also it comprehends how your application is handling information and simply deciding.
Empowering Debugging with Flutter DevTools
Flutter DevTools is your digital assistant in the world of debugging. Which provides you with an array of powerful tools that unveil the inner workings of your Flutter app. Imagine having a backstage pass to your app’s performance, widgets, and even network activity – that’s exactly what Flutter DevTools offers. DevTools gives you an interactive dashboard to monitor and analyze key metrics, such as frame rendering times and memory usage.
The widget inspector allows you to dissect your UI hierarchy, enabling you to identify layout issues and track down UI-related bugs with ease. Additionally, the timeline view lets you visualize the sequence of events during your app’s execution. Also provides valuable insights into how different components interact.
Guarding Your Code: The Assert Statement
Consider the assert statement as a vigilant guard positioned inside your code prepared to raise an alert in the event that something isn’t correct. Similarly, as you’d twofold really look at your backpack prior to setting out on an excursion, assert statements act as a safety net. This will helps in assisting you with getting possible issues at the earliest phases of your application’s execution.
This is how it works: you embed an assert statement with a predetermined condition that you need to approve. Assuming that the condition evaluates to false during runtime, your application ends, and an error message will be shown. Like a built-in warning system, it quickly cautions you when suspicions about your code’s way of behaving don’t turn out as expected.
Assert statements are unquestionably convenient during improvements. Also it helps you to catch mistakes early and prevent them from snowballing into more significant issues. They serve as your code’s guardians, enforcing logical checks that align with your intentions. By consolidating assert statements decisively, you can expand the robustness and reliability of your code. Which makes investigating further to reducing the extent of likely issues.
Notwithstanding, it’s critical to understand that declaration statements are disabled in production builds. So they won’t influence your application’s exhibition for end clients.
Debugging with Logger
The power of the ‘logger’ package in Flutter may be compared to having a magic lens that allows you to witness every stage of your app’s journey. Installing the “logger” package is like bringing on a seasoned detective to help with debugging. Since it offers thorough insights into what your app is doing, especially when it comes to API calls. In order to use this magic: your toolbox is immediately expanded when you add the “logger” package to your project’s dependencies in the “pubspec.yaml” file.
With this package at your disposal, you may easily log messages of varying severity levels, from errors to debugging data and anything in between. You may use the logger class’s robust features by creating an instance of it after importing the ‘logging’ package into your Dart files. When dealing with API requests, the ‘logging’ package excels. Consider developing a weather application that retrieves information from a remote source. With the logger, you will be able to keep track of an API call’s complete lifespan.
That is, from the time the request will be sent to the time the answer will be receiving and start processing. You may reveal the intricate intricacies of these exchanges by recording messages at crucial moments, which makes it simpler to identify any potential problems. The logger package gives you the ability to track the API’s trip, making complicated debugging scenarios doable jobs. This will include activities like reviewing the payload, verifying the response status, and making sure the data is successfully processed.
Wrapping Up
Flutter debugging does not have to be difficult. You may find issues and improve the quality of your app by using straightforward approaches like print statements, breakpoints, Flutter DevTools, and assert statements. Additionally, by including the ‘logging’ package in your toolbox, you’ll have a dependable partner for monitoring API calls and enhancing the accessibility of the adventure that is debugging. So go ahead, explore, and develop your superpower of debugging!
- Agentic AI1
- Android Development3
- Artificial Intelligence37
- Classified App3
- Custom App Development5
- Digital Transformation12
- Doctor Appointment Booking App14
- Dropshipping1
- Ecommerce Apps40
- Education Apps2
- Fintech-Apps38
- Fitness App4
- Flutter4
- Flutter Apps20
- Food Delivery App5
- Grocery App Development1
- Grocery Apps3
- Health Care10
- IoT2
- Loyalty Programs9
- Matrimony Apps1
- Microsoft1
- Mobile App Maintenance2
- Mobile Apps130
- On Demand Marketplace1
- Product Engineering6
- Progressive Web Apps1
- React Native Apps2
- Saas Application2
- Shopify9
- Software Development3
- Taxi Booking Apps7
- Truck Booking App5
- UI UX Design8
- Uncategorized7
- Web App Development1


Comments